

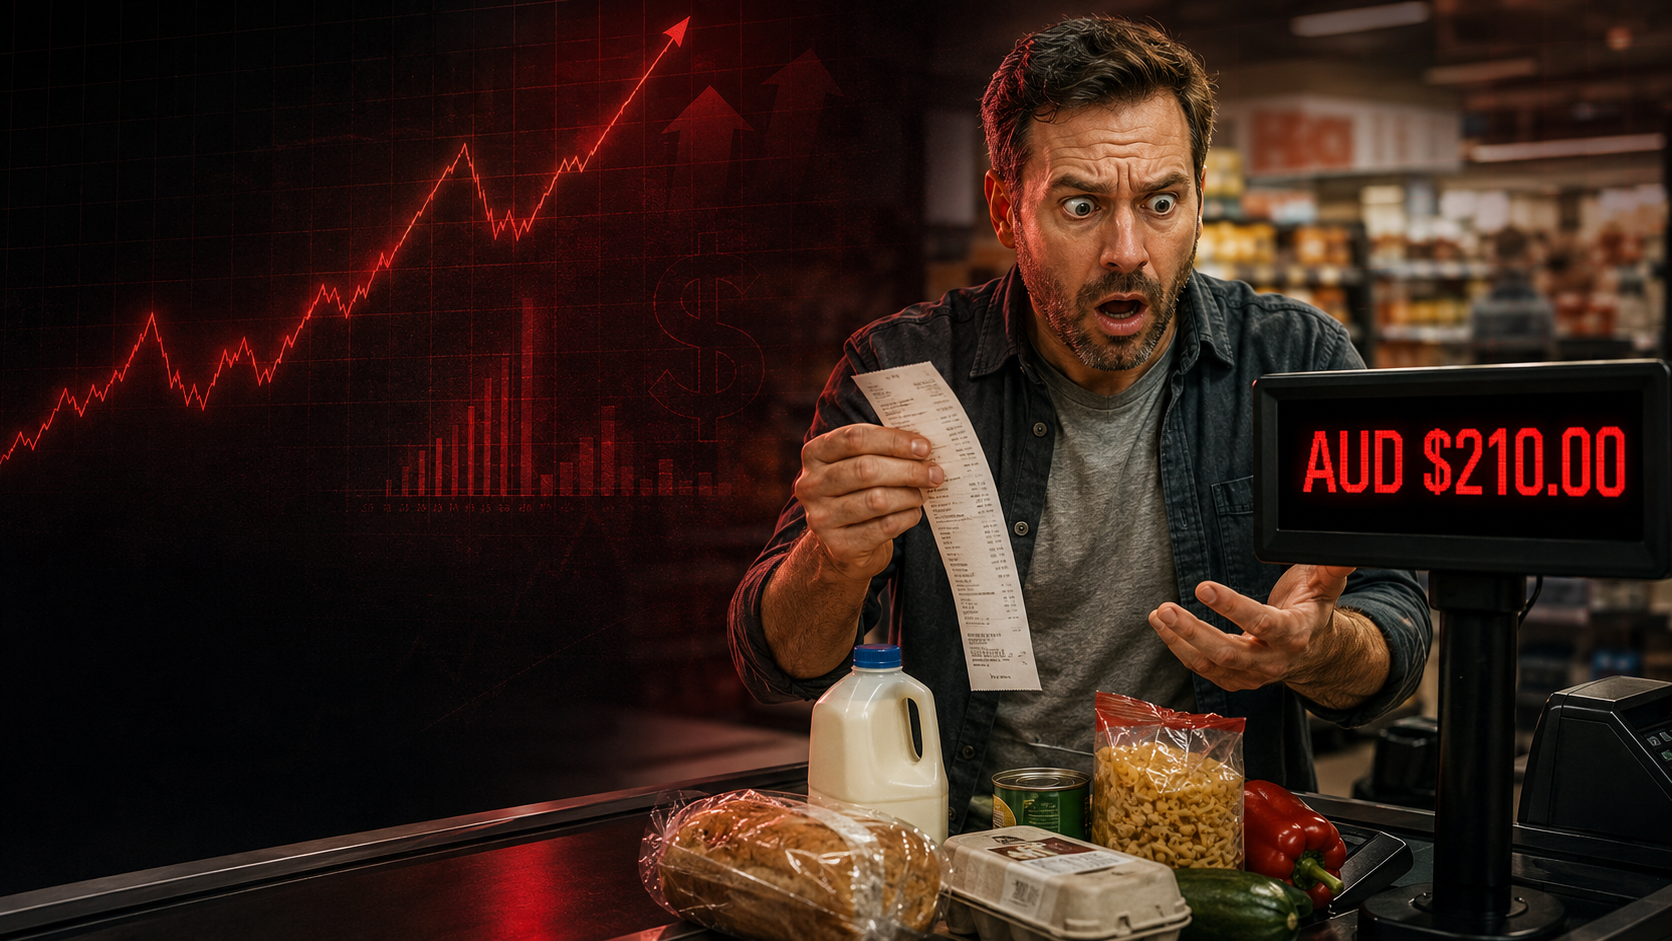
The Marginal Dollar: What a $210 Grocery Receipt Revealed About the Australian Consumer
How a firsthand shopping experience became a journey through marginal utility, inflation transmission, substitution, capital flows and competitive adaptation — and what it says about how organisations listen to the people who fund them. – this blog post is inspired through a first hand experience with Coles whilst taking the time to muse on the impact of a $210 grocery bill for basic household items, food that may make a max of 4 meals, and key home replenishments following my return from my trip from the UAE to see my son for his 3rd birthday.
——————————————————-
It started with a receipt!
What began as a firsthand experience shopping at Coles as a one-person household became an unexpectedly useful exercise in applied economics. What is important here, is firstly reading this article about the book Competing Against Luck: The Story of Innovation and Customer Jobs by late Professor Clayton Christensen, one of whom I venerated and cherished all of his books! This book is integrated in another article about creativity, as it is through creativity that the blog post is inspired opposed to objective, traditional systems analysis!
A receipt provided the stimulus. Discussion challenged the observation. Economic theory provided the framework. This article asks the bigger question.
Approximately $210 for groceries, a handful of meals and basic household consumables felt striking — not because one receipt proves anything, but because it prompted an introspective discussion on social media about how much purchasing power has actually eroded. One basket is an anecdote. It cannot, on its own, establish a trend. But it can prompt a legitimate question, and legitimate questions deserve to be followed through properly rather than left as a passing complaint.
So this piece follows that same path: experience → discussion → economic analysis → systems inquiry.
——————————————————-
Then someone challenged the observation
The response to the original post wasn’t uniform agreement, and that mattered. Some of it pushed back directly: one basket is anecdotal; supermarket margins aren’t the same thing as the checkout price; different households make different choices; headline inflation might tell a different story entirely.
That pushback was the right response to have, and the right way to answer it isn’t defensiveness — it’s introspection. Is the observation actually representative of anything, or is it just one person’s shopping trip on one particular day? What would it take to know the difference?
That’s the discipline this piece tries to hold to throughout: separate what was observed from what can be verified, and verify before drawing conclusions.
——————————————————-
What does $210 actually mean?
The number needs context before it means anything. Context, here, means comparing it against what an Australian household actually has coming in — and doing that honestly means showing a spread of incomes, not picking whichever one makes the strongest point.
Using the Fair Work Commission’s National Minimum Wage (effective 1 July 2026: $1,004.90 gross per week) and the Australian Bureau of Statistics’ most recent *Employee Earnings and Hours* release (reference period May 2025, published January 2026), a $210 basket represents:
– 20.9% of a full week’s gross National Minimum Wage
– 11.1% of median weekly earnings for all full-time employees ($1,887.00)
– 10.5% of median weekly earnings for full-time male employees specifically ($1,994.00)
– 11.9% of median weekly earnings for full-time female employees specifically ($1,758.00)
A few things are worth being precise about here, because the precision is the point. These are median figures, not averages — medians aren’t dragged around by a small number of very high earners the way averages can be, which makes them the more honest single number for “what does a typical full-time employee actually earn.” And every one of these is a gross, pre-tax figure. Grocery spending happens out of what’s left after tax, and typically after housing, utilities, insurance, transport and healthcare have already taken their share. Measured against gross income, the burden of a $210 shop already looks meaningful. Measured against what’s actually left in a household’s account after those commitments, it looks larger still.
That’s the honest way to frame the point: not “the average consumer,” but a spectrum. A minimum-wage single-income household experiences that $210 very differently from a dual-income household on full-time median earnings — and even within “full-time median,” the experience differs by sex, industry, region and whatever fixed costs happen to sit on top of the wage.
——————————————————-
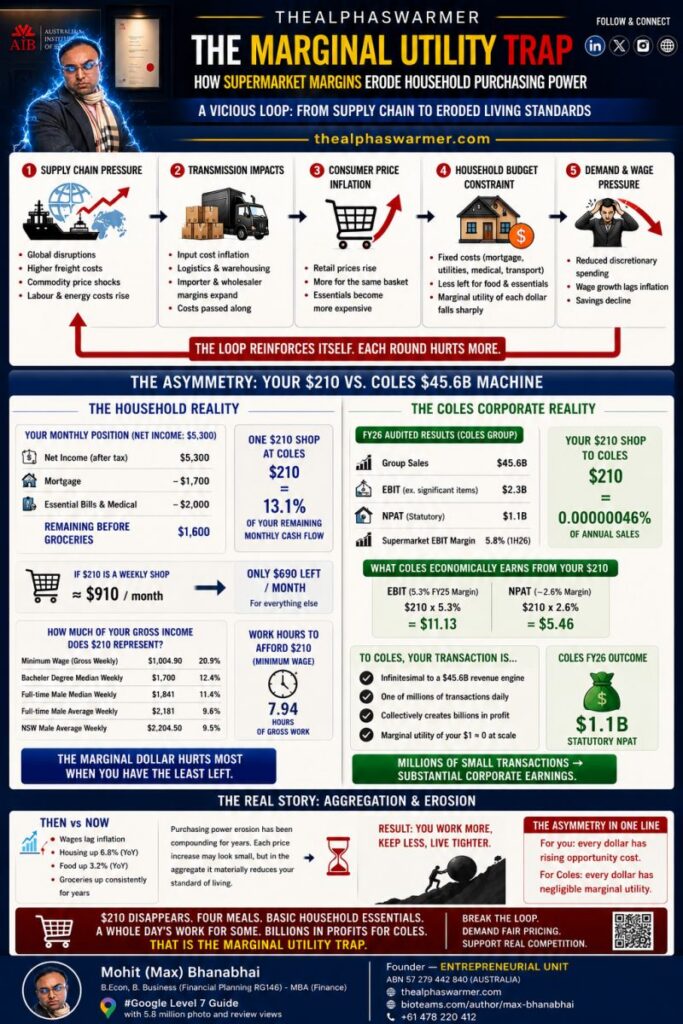
NB: The infographic may not have verifiable figures, which is another reason
for why augmented intelligence is required to audit, verify, and connect,
against true available data sources. Despite that, the material argument remains.
-------------------------------------------------------
The marginal dollar is not equal
Here is the part worth being careful about, because it’s easy to get wrong in either direction.
The observation is not: “Coles charges $210, therefore Coles makes $210.” Nor is it: “corporate profit is inherently wrong.” Both of those are lazy readings of a more interesting point.
The more defensible proposition is that the economic significance of the marginal dollar is asymmetric across economic actors.
For a household approaching its budget constraint, residual disposable income becomes scarce, and every dollar left in that residual carries a rising opportunity cost — spending it here means not spending it on something else that also matters: food, transport, insurance, healthcare, savings. Economists call this diminishing marginal utility of income: the same dollar buys less *relief* the closer a household sits to the edge of its budget.
For a corporation turning over tens of billions of dollars a year, one additional consumer dollar is, in isolation, immaterial. It’s worth being precise about what that actually means, though: utility isn’t measured in dollars, and a $210 expenditure isn’t a $210 “loss” — the household receives groceries in exchange. The point isn’t that the transaction destroys value. The point is about *relative significance*: the same $210 sits at very different points on two very different utility curves, for the household spending it and the corporation receiving it.
——————————————————-
One transaction, two very different scales
Coles Group’s FY26 results give the corporate side of that scale precisely. Group sales revenue was $45.58 billion, up 2.8% on the prior year, with the supermarkets division specifically contributing $41.47 billion of that, up 3.7%. Statutory net profit after tax was 1.09 billion, up 1.0% — a figure that included a $235 million significant item ($165 million after tax) relating to the Federal Court’s 2025 judgment in Fair Work Ombudsman proceedings against the company. Strip that one-off out, and NPAT excluding significant items rose 13.7% to $1.26 billion.
That distinction — statutory result versus underlying, ex-significant-items result — isn’t pedantry. They tell genuinely different stories about the same year, and conflating them (or worse, calling an adjusted figure “audited” when only the statutory result actually is) misrepresents both.
Set a single $210 transaction against $45.58 billion in annual sales and it amounts to roughly 0.00000046% of that year’s revenue — a number so small it’s really just a way of saying: at that scale, one transaction is not a rounding error, it’s below the threshold where rounding errors happen at all.
None of this is an argument that Coles’ margins are enormous — high-volume grocery retail is, in fact, a relatively thin-margin business by most industry standards, and nothing here should be read as claiming otherwise. The more interesting observation is structural, not moral: **a transaction can be almost irrelevant at corporate scale while being highly consequential at the household’s residual-budget scale — and both of those things are true at exactly the same time, about exactly the same $210.**
Millions of individually immaterial transactions is exactly how you arrive at $45.58 billion in the first place. The asymmetry isn’t a flaw in the system. It’s simply what aggregation looks like from both ends of it.
——————————————————-
How inflation travels
To understand why $210 buys what it buys today, it helps to trace how a price actually gets to the shelf. The mechanism runs, in broad strokes: external shocks — energy, commodities, freight, labour, currency movements — raise costs for producers and importers, which flow into wholesale costs, which flow into retail costs, which arrive at the consumer as a shelf price, which compresses the household budget that has to absorb it.
Economists call the degree to which a cost increase actually makes it through to the final price “pass-through,” and it’s rarely 100% or instantaneous — retailers absorb some of it, delay some of it, or pass more or less than the underlying cost movement depending on competitive pressure and their own margin position.
Here’s a distinction that matters more than it sounds like it should: once a higher price level is established, a *falling inflation rate* does not mean prices are falling. It means prices are rising more slowly than they were. That’s disinflation, not deflation, and the difference is the entire lived experience of the last several years compressed into one sentence. Headline CPI can decelerate sharply while the price of everything a household actually buys stays exactly where the last round of increases left it — or higher.
——————————————————-
Why lower inflation doesn’t give purchasing power back
The household doesn’t experience “headline CPI.” It experiences an actual portfolio of prices — its own rent or mortgage, its own energy plan, its own grocery basket, its own petrol usage — and that portfolio can move quite differently from the aggregate number reported each quarter.
On the latest ABS Consumer Price Index release (the twelve months to July 2026), annual food and non-alcoholic beverage inflation sat at 3.2%, driven particularly by meals out and takeaway (+4.5%). Housing was the largest single contributor to the year’s inflation overall, up 5.0%, driven by new dwelling construction costs passing on higher materials and labour pricing. Two households with identical gross incomes can live through that same twelve months very differently depending on whether they’re renting, paying down a mortgage, raising children, managing a health condition, or servicing debt — the CPI print is one number; the lived experience underneath it is a distribution.
Inflation, in other words, is reported as an aggregate rate. Purchasing-power erosion is experienced at the margin — in whatever’s left after the fixed costs have already been paid.
——————————————————-
Does cost relief travel backwards?
This is the question the original social media discussion actually turned on, and it’s a more interesting question than “are groceries too expensive.”
We have a reasonably intuitive grasp of how cost pressure moves forward through a supply chain into consumer prices. The less obvious question is what happens when those upstream pressures ease — when freight normalises, when energy costs come off their peaks, when scale, automation, sourcing and productivity generate genuine efficiencies inside a retailer’s operations. How much of that reversal actually makes its way back to the household, and how quickly?
There’s no reason to assume the process is symmetric, and good reasons to think it usually isn’t. Prices tend to be sticky on the way down for reasons that have nothing to do with any particular company acting in bad faith: wage costs don’t reverse when input costs do; long-term leases and supply contracts lock in earlier pricing; financing costs and capital expenditure commitments don’t move with a single quarter’s cost relief; there are real menu costs to repricing constantly; inflation expectations themselves become somewhat self-fulfilling; and after a period of margin compression, there’s a natural commercial incentive to rebuild margin before passing relief through.
The empirical question — do adverse cost shocks pass through faster and more completely than subsequent cost relief — has a name in the economics literature: asymmetric price transmission, sometimes summarised as the “rockets and feathers” effect (prices go up like a rocket, come down like a feather), most extensively documented in retail fuel markets but studied more broadly across consumer goods. It’s genuinely mixed and market-specific evidence, not a settled universal law, and it would be overreaching to claim Australian grocery retail specifically has been rigorously proven to exhibit it. But the pattern is well-documented enough elsewhere that it’s a legitimate lens to bring to the question, rather than an accusation to make with certainty.
——————————————————-
The consumer starts searching
Groceries, as a category, are close to a necessity. But that doesn’t mean demand for any *particular* retailer, format or brand is similarly inelastic — and this is where the household stops being a passive recipient of pricing decisions and starts being an active participant in the system.
The margins of adjustment are numerous: Coles versus Woolworths versus Aldi versus independents; private label versus branded; premium versus value tiers; fresh versus frozen; basket composition; bulk purchasing; shopping frequency; promotional timing; online search and price comparison; delivery versus in-store; and, at the extreme, simply removing discretionary items from the basket altogether.
Economists have vocabulary for exactly this kind of adjustment — price elasticity, cross-price elasticity, the substitution effect, the income effect, search costs, switching costs, revealed preference — but the underlying insight doesn’t need the vocabulary to make sense: persistent affordability pressure may not eliminate grocery demand. It can redirect where the grocery dollar flows.
——————————————————-
Follow the $210
It’s worth tracing that $210 as an actual flow rather than a single number.
At the household level: gross income, less tax, less mortgage or rent and other essential commitments, leaves a residual disposable pool — and the grocery allocation comes out of that pool, not out of gross income directly.
At the retailer level: that $210 becomes part of Coles’ revenue, which is then distributed onward — to suppliers, to wages, to logistics and property costs, to technology and capital expenditure, to tax, and whatever remains becomes retained earnings, dividends or reinvestment.
Zoom out further and competition enters the flow: budget pressure prompts consumer search; search enables substitution; substitution reallocates expenditure; reallocated expenditure shows up, eventually, as a change in market share; and a shift in market share is itself a signal that provokes a competitive response — in pricing, in investment, in the pursuit of productivity gains.
The money hasn’t vanished at any point in that chain. It has changed hands and entered a network of competing claims on it. The genuinely interesting systems question is: at what point does accumulated household friction redirect enough of that flow to actually alter the economics of an incumbent, and finance the economics of an alternative?
When millions of micro-decisions become a market signal
One household switching where it shops is economically trivial — a rounding error inside a rounding error. Millions of households making a similar decision, even independently and for their own individual reasons, is not.
The chain runs: individual dissatisfaction, to search, to substitution, to a reallocation of household flow, to a measurable change in market share, to a competitive signal that the incumbent has to respond to, to capital allocation decisions, to an actual market response. That’s the bridge between individual household behaviour and industry-level, even macro-level, outcomes — and it’s a genuinely emergent process, not something any single actor designs from the top down.
The proposition worth sitting with is that aggregated consumer friction isn’t only a welfare outcome to be lamented. It’s information. Aggregated and read correctly, it can reveal unmet demand, mispriced categories, service gaps, logistics inefficiencies, and — for anyone paying attention — genuine openings for a new operating model or a new pool of capital to move into.
Why Aldi matters
The ACCC’s Supermarkets Inquiry final report (February 2025) put a number on Australia’s grocery concentration: Woolworths holds roughly 38% of national supermarket grocery sales, Coles roughly 29%, Aldi roughly 9%, and Metcash — as a proxy for the independent supermarkets it supplies — around 7%. Coles and Woolworths together account for about two-thirds of the market, and the ACCC’s own characterisation was of an oligopolistic structure in which the two majors have limited incentive to compete vigorously against each other on price.
Aldi is the most visible real-world example of a differentiated operating model capturing flow away from that duopoly — a smaller store footprint, a narrower and more private-label-heavy range, and a fundamentally different cost structure. What’s easy to miss is how long that took: the ACCC’s own report notes it took Aldi roughly two decades to reach a 9% national share, which says as much about the barriers facing any new entrant — property, distribution infrastructure, supplier relationships, planning and zoning constraints — as it does about consumer appetite for an alternative. This isn’t an Aldi advertisement. It’s evidence that when household search intensity rises, a genuinely different format can capture share — slowly, against real structural resistance, but measurably.
Contestable markets, and their real-world limits
Contestable-market theory adds a useful wrinkle here: an incumbent’s behaviour can be shaped not only by the competitors actually operating in its market today, but by the credible *threat* of a new entrant, even one that hasn’t arrived yet.
Australian grocery retail is a good test case for the gap between that theory and reality. The barriers to entry are substantial and largely structural rather than regulatory: distribution centre networks, existing store footprints, established supplier relationships, planning and zoning approval timelines, and the scale economies that come from decades of accumulated logistics density. Contestability in theory doesn’t erase those barriers in practice — which is exactly what makes the next question worth asking seriously rather than dismissing.
Does Amazon need to build another Coles?
Amazon Australia’s fresh-grocery footprint is real and growing, though it would be a mistake to overstate what it currently is. Since launching a partnership with Harris Farm Markets in January 2026, Amazon has expanded fresh-grocery delivery through that partnership to more than 80 Sydney suburbs, more than 90 Brisbane suburbs, and areas of the Gold Coast and Canberra, offering same-day and next-day delivery via Amazon Flex on orders above a $50 minimum. That sits alongside Amazon’s existing, larger non-perishable grocery and household-essentials catalogue.
That is not, as things stand, a national full-line supermarket competitor to Coles or Woolworths, and nothing here should be read as claiming it is. But it raises a more interesting strategic question than “will Amazon become a supermarket”: does a logistics-native entrant actually need to build another Coles at all?
There’s a real possibility in unbundling the supermarket basket rather than replicating it whole — pantry staples, household consumables, recurring and subscription-style purchases, bulk items and last-mile delivery are all logistically compatible with what Amazon already does well, without requiring the cold-chain infrastructure, spoilage management, and store-network density that a full fresh-grocery operation demands. A partnership model, like the one already running with Harris Farm, plausibly lets Amazon pick off the profitable, logistically tractable slices of the basket while leaving the hardest parts — perishables at national scale, in-person browsing, immediate availability — to the operators already built for it.
This is scenario analysis, not a prediction. But it’s a genuinely different competitive threat than “another supermarket chain,” and probably a more realistic one given Australia’s geography and the economics of fresh-food logistics.
Consumer friction as information for capital
Pull all of the above together and a pattern emerges that has nothing to do with any single company’s pricing decisions. A frontline experience generates friction. Friction, aggregated across enough households, becomes a signal. That signal either reaches the parts of an organisation — and a market — capable of acting on it, or it doesn’t. When it does, you get Aldi’s slow, structurally-resisted rise; you get a partnership model like Amazon and Harris Farm testing whether the basket can be unbundled; you get incumbents investing in efficiency to defend share they can feel slipping.
When it doesn’t reach anyone who can act on it, the friction just sits there as background resentment — real, but inert.
From frontline experience to systems intelligence
This is the part of the inquiry that matters most, and it’s less about supermarkets specifically than about how any large organisation is actually built.
A $210 receipt is frontline data. It’s real, it’s timestamped, and it’s exactly the kind of signal that, multiplied across enough households, tells a retailer something genuinely useful about where its pricing, its category mix, or its competitive position sits relative to what customers can actually absorb. The question worth asking isn’t whether that signal exists — it obviously does, in the form of social media commentary, customer service complaints, loyalty-program churn, and basket-composition shifts. The question is whether it ever reaches the people inside the organisation who could do something with it.
In most large organisations, it doesn’t — not because anyone is ignoring customers on purpose, but because of how the organisation is structured. Customer sentiment often lives with a marketing or communications team. Pricing decisions live with a commercial or category team. Supply chain and sourcing efficiencies live with procurement. Each of those functions can be doing good, competent work in isolation, and the aggregate outcome can still be poor, simply because the signal generated at the frontline never crosses the internal boundary into the team positioned to act on it. That’s a silo problem, not a strategy problem — and it’s a far more common failure mode in large organisations than any individual person or team getting something wrong.
This is the part of the inquiry an entity like Entrepreneurial Unit is actually built around: not offering an opinion on whether a specific price is fair, but building the habit — and eventually the infrastructure — of treating frontline friction as a genuine feedback loop rather than a one-way broadcast. See what others miss. Understand where the friction actually originates in the system, not just where it’s loudest. Find the leverage point — which is rarely the place where the complaint is voiced, and usually somewhere upstream of it, in sourcing, pricing architecture, or operating model. Route that intelligence to whoever can actually act on it, rather than letting it dead-end in the function that merely absorbs it. Make a better decision as a result. That sequence, repeated, is what turns isolated customer friction into compounding organisational improvement — and it’s the same sequence this article has just walked through, applied to a single grocery receipt instead of a single business.
A business leader reading this might reasonably ask whether the same friction — real, timestamped, currently dead-ending somewhere in their own organisation — exists inside their own customer journey, their own supply chain, their own pricing model. That’s the only pitch this article intends to make, and it’s deliberately left as a question rather than an answer.
The customer funds the system
“The customer is king” gets used often enough as a slogan that it’s worth restating with the actual economics behind it, because the phrase deserves better than a platitude.
The customer funds the system. Every dollar of consumer expenditure is the ultimate source of retailer revenue, which is the ultimate source of supplier payments, wages, logistics spend, property costs, capital investment, tax paid, profit generated and capital returned to shareholders. Nothing further down that chain exists without the transaction at the top of it.
That doesn’t mean every customer demand has to be satisfied, or every price has to fall. It means persistent end-user friction is economically meaningful information, not noise to be managed away with better messaging. When a system stops producing enough perceived value for the price being asked, consumers search, substitute, and redirect their flow elsewhere — and that redirection is consumer sovereignty, expressed not as a complaint but as capital reallocation, one household at a time, aggregating into something a market eventually has to respond to.
The questions worth asking next
A $210 receipt was the stimulus here, not the conclusion.
The more durable questions are the ones that outlast this particular basket, this particular retailer, and this particular year’s inflation print: What happens to the marginal household dollar as fixed costs consume a growing share of income? How symmetric is inflation pass-through when upstream cost pressures actually reverse? At what point does consumer search tip into substitution, substitution into measurable market share, and market share into a signal capital has to respond to? Can a genuinely different operating model deliver the same household value at a lower system-wide cost? And inside any given organisation — not just a supermarket — where are the silos that stop frontline friction from ever reaching the people positioned to act on it?
A simple customer experience can contain a system-level signal, if the people receiving it are willing to observe it, challenge it, verify it, connect it, and follow where the money — and the information — actually goes.
The customer funds the system. The system should never stop listening to the customer, and building the mechanism that actually does the listening is, in the end, the more useful project than winning the argument about whether one receipt was too expensive.
—
Mohit (Max) Bhanabhai
Founder — Entrepreneurial Unit
thealphaswarmer.com
#thealphaswarmer
—
Source list
1. Fair Work Commission — National Minimum Wage, effective 1 July 2026 ($1,004.90/week)
2. Australian Bureau of Statistics — *Employee Earnings and Hours, Australia*, reference period May 2025, released 23 January 2026 (median weekly earnings by full-time status and sex)
3. Australian Bureau of Statistics — *Consumer Price Index, Australia*, July 2026 release (annual Food and Housing inflation)
4. Coles Group — FY26 full-year results (sales revenue, statutory NPAT, NPAT excluding significant items, Fair Work Ombudsman significant item)
5. Australian Competition and Consumer Commission — Supermarkets Inquiry, final report, February 2025 (market share estimates, Aldi entry timeline, barriers to entry)
6. Amazon Australia / Harris Farm Markets — fresh grocery delivery partnership announcements, January–2026 expansion updates (Sydney, Brisbane, Gold Coast, Canberra)
7. Original LinkedIn post and infographic, Mohit (Max) Bhanabhai, 2026 (primary provenance of the observation and discussion — not economic evidence)